

Dashboards people actually check.
Business intelligence dashboards that turn scattered data into decisions your team can actually act on — not another report nobody opens.
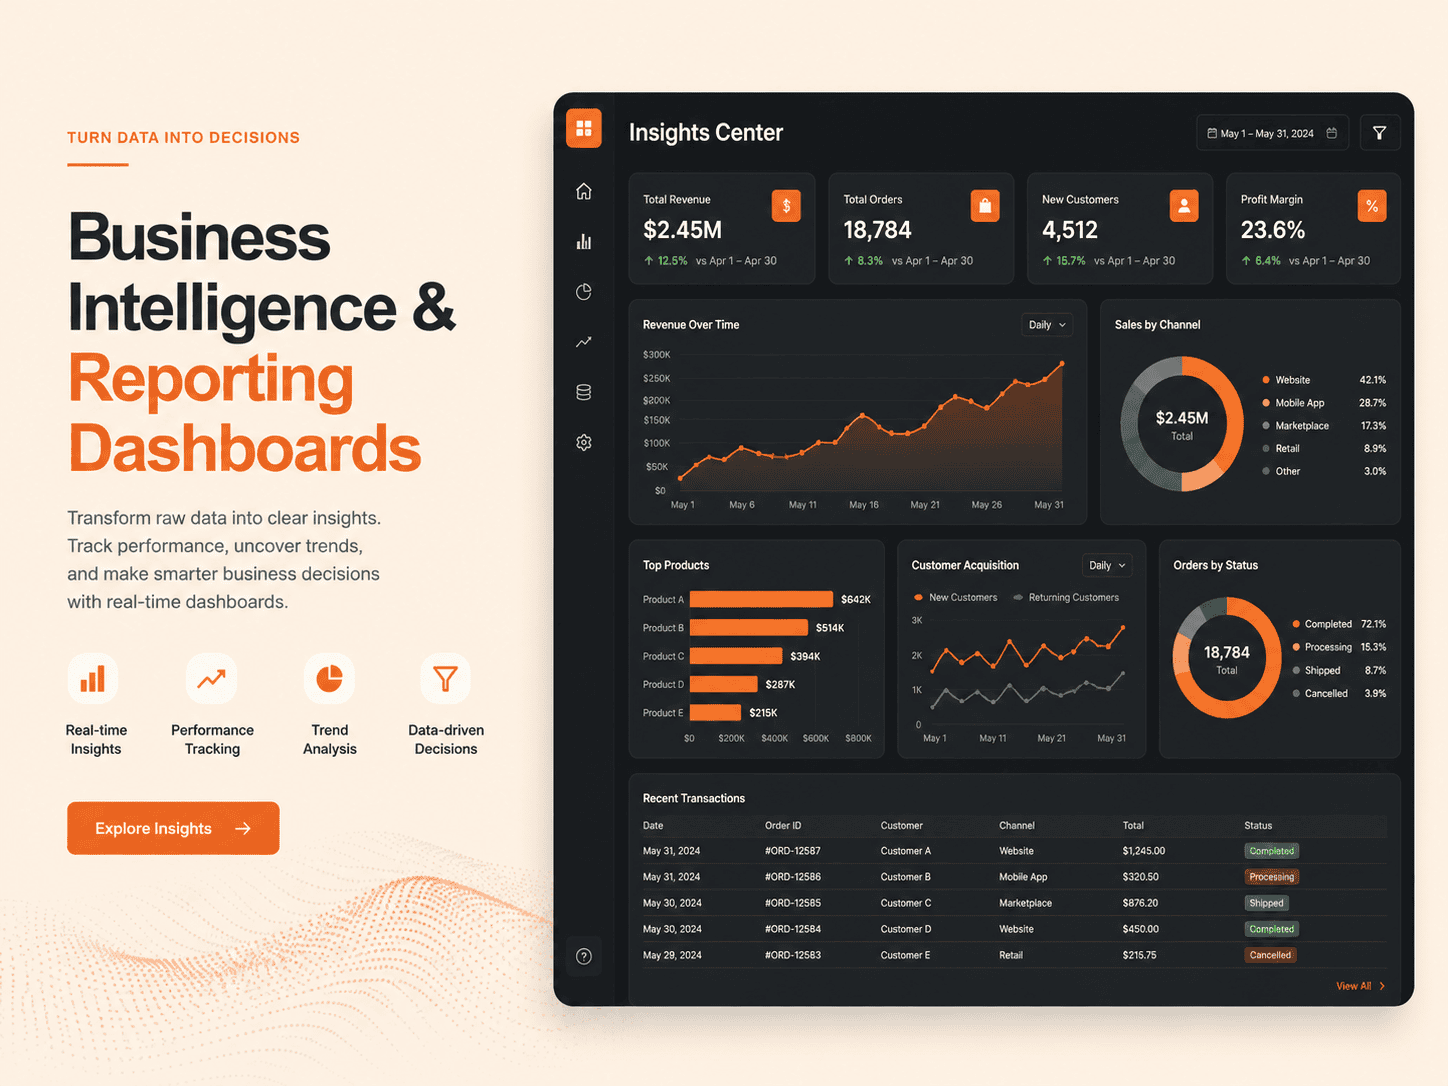
Why most dashboards genuinely go unused after the initial excitement fades
Many BI projects deliver technically impressive dashboards that genuinely go unused within weeks of launch, since the initial excitement of a new tool fades quickly if the dashboard doesn't answer questions people actually need answered on a recurring basis. Dashboards people genuinely keep checking are built around real decision-making needs, not comprehensive metric coverage for its own sake — showing exactly what matters for the specific decisions your team makes regularly, rather than everything that could theoretically be measured.
We build dashboards pulling from whatever data sources genuinely matter to your business, connecting disparate systems into unified, reliable views rather than requiring manual data compilation. Automatic updates keep dashboards genuinely current, since stale data that requires manual refresh quickly gets abandoned in favor of whatever spreadsheet people trust more. Different teams get different views tailored to their actual responsibilities, since a dashboard trying to serve everyone equally often serves no one particularly well. Where you don't already have solid underlying data infrastructure, we build the pipeline too, since a polished dashboard sitting on top of unreliable data ultimately produces the exact mistrust it was meant to prevent.
Everything this solution actually covers
Custom Dashboards
Dashboards built around the specific decisions your team actually needs to make.
Data Pipeline Setup
Reliable pipelines that keep dashboards current without manual updates.
Multi-Source Integration
Data pulled together from separate systems into one clear view.
Role-Based Views
Different dashboards for different teams, showing what's relevant to each.
Automated Reporting
Scheduled reports delivered automatically instead of built by hand each month.
Ongoing Refinement
We refine dashboards as your metrics and priorities evolve.
How we get there
Discover
We identify the specific decisions each dashboard needs to support.
Design
We design dashboard layouts around clarity, not just showing everything available.
Build
We build data pipelines and dashboards with proper validation.
Launch & Refine
We launch and refine based on how teams actually use the dashboards.
Built on tools that scale with you
A few projects we’ve shipped recently

Fallowmere Group
A unified financial dashboard replacing three separate manually-built reports.
View Case Study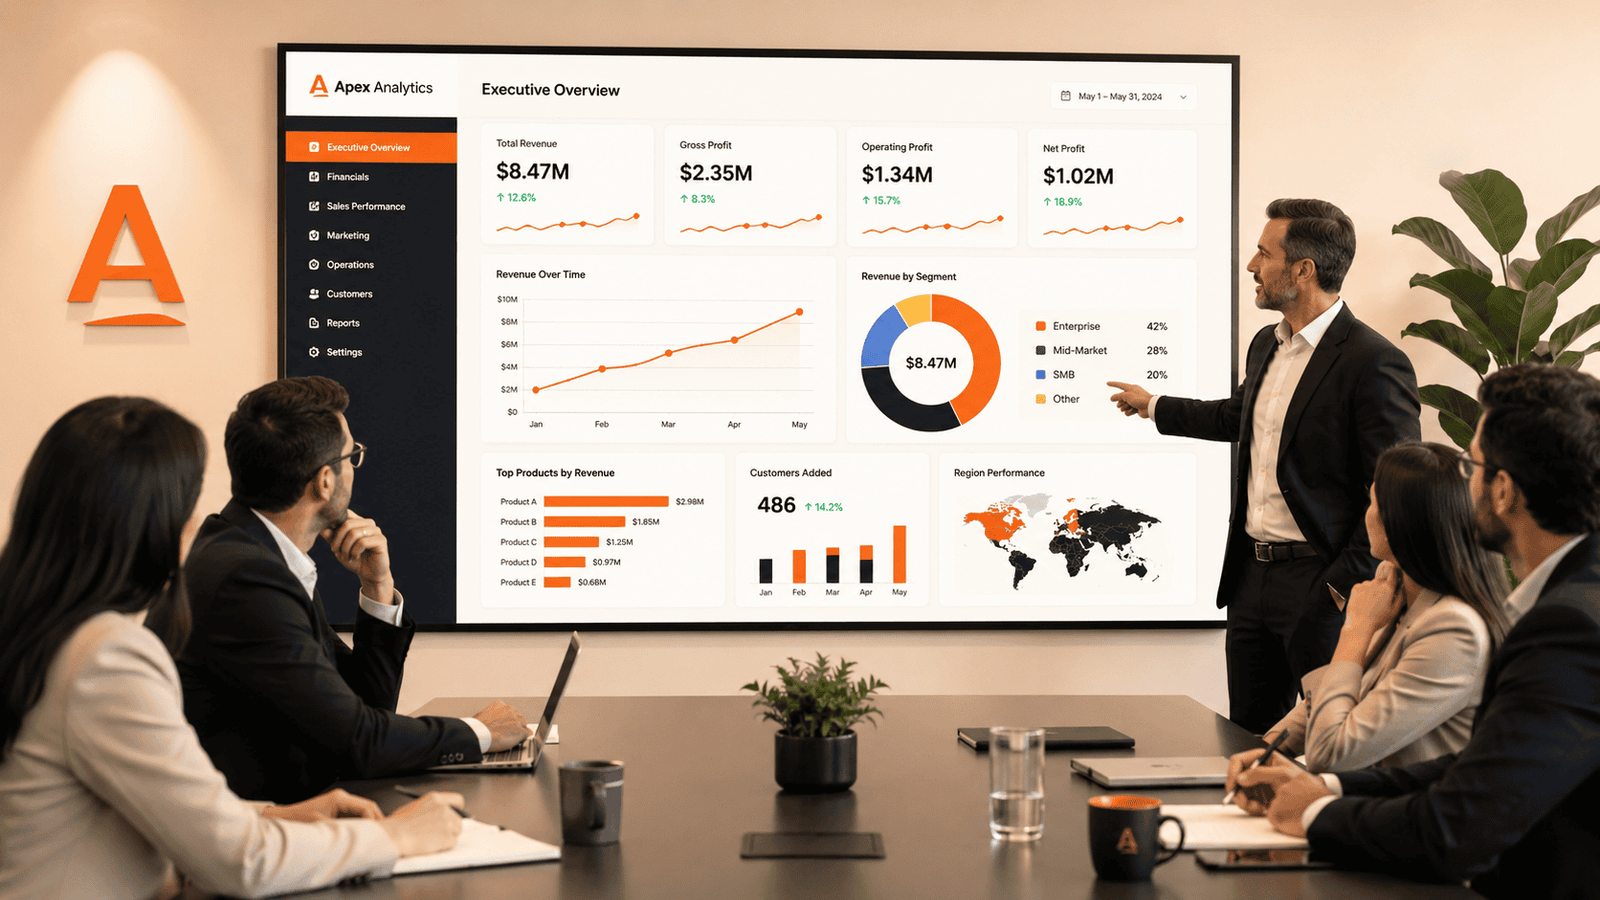
Granger Retail Group
A sales performance dashboard used daily by store and regional managers.
View Case Study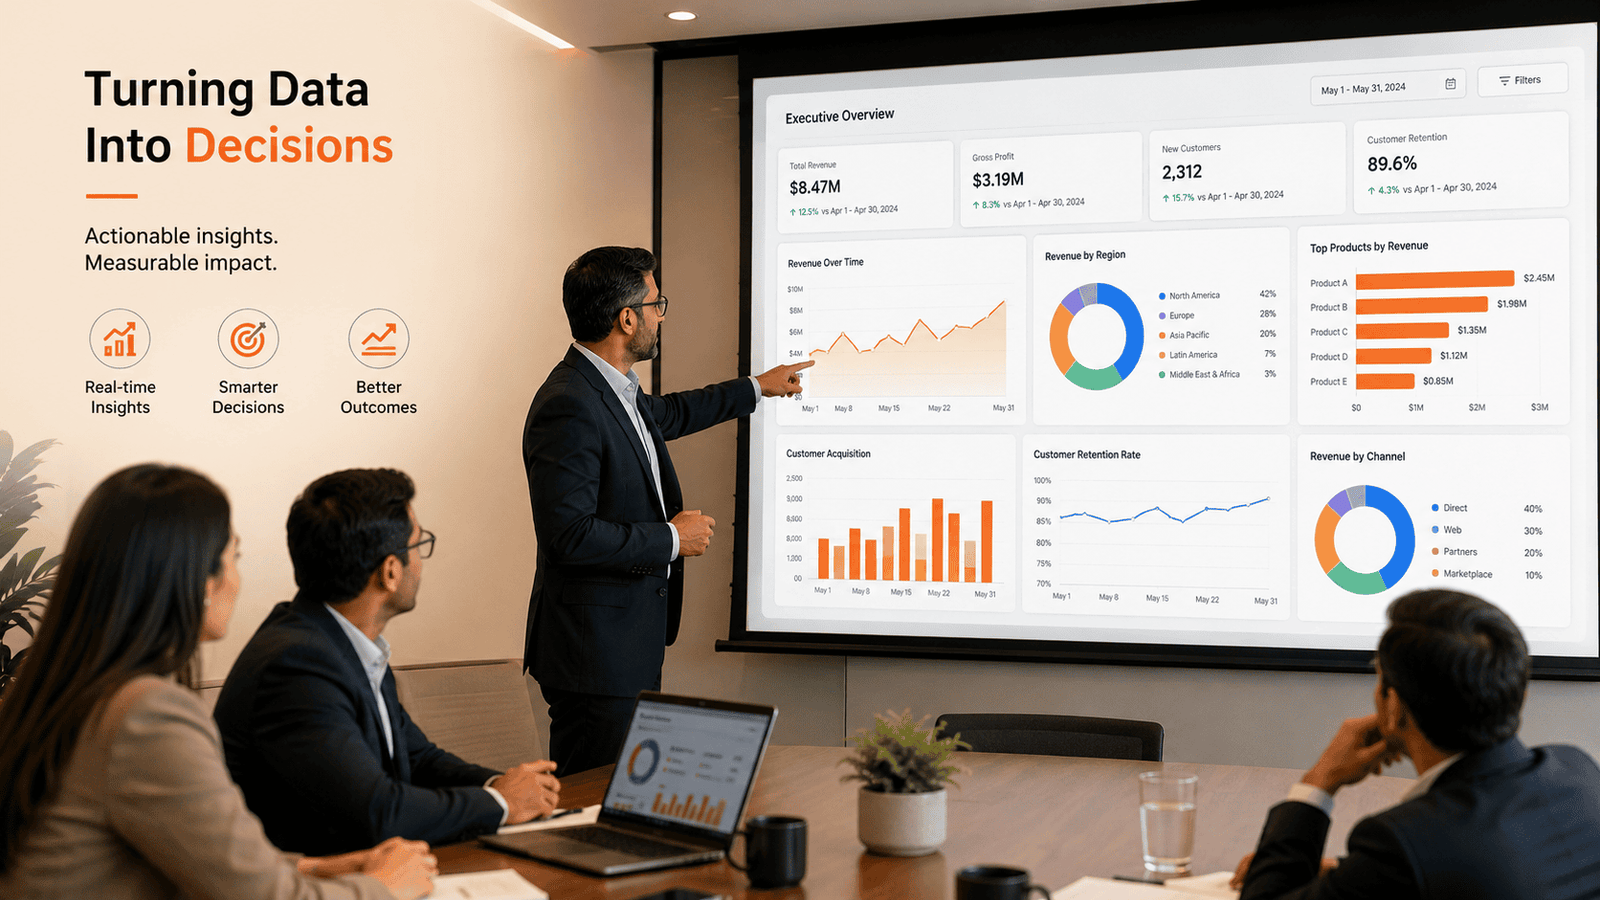
Hawksmoor Software
A product usage dashboard that clarified which features actually drove retention.
View Case Study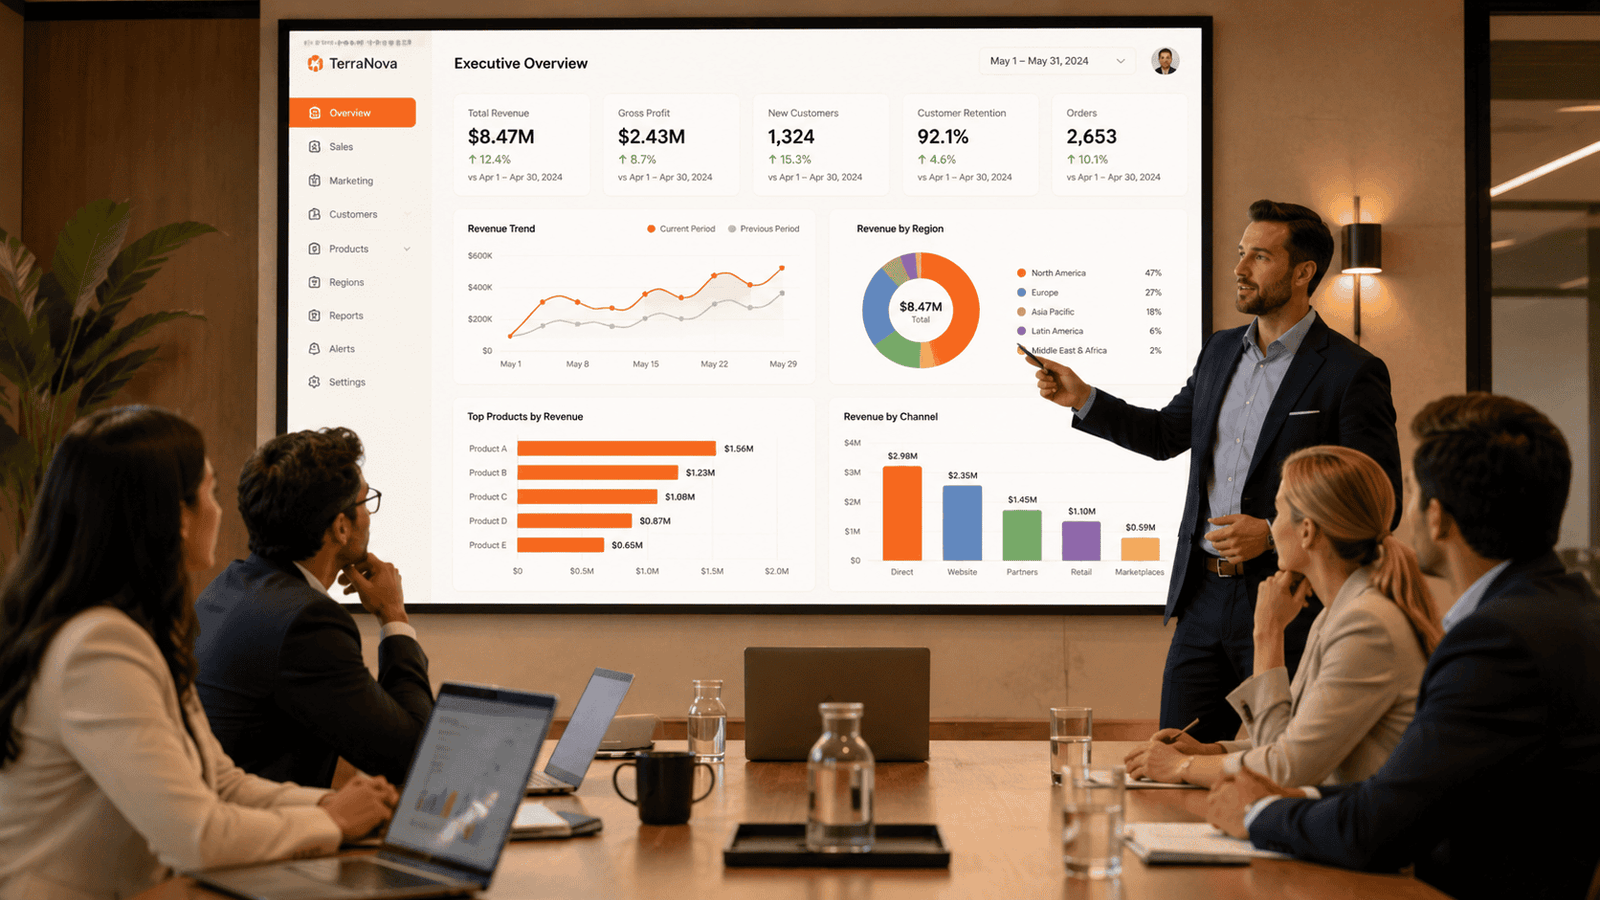
Islington Industries
An operations dashboard giving plant managers real-time production visibility.
View Case StudyWhat clients say
Common questions
Ready to get started with Business Intelligence & Reporting Dashboards?
Let's talk about your project — no pressure, just a straightforward conversation about what you need.
Book an Appointment