

Get In Touch
hello@digitallyscaled.com
Ph: +1 (713) 949-5161
Office
Houston, TX, United States
Home/Software/Business Intelligence & Reporting Dashboards
Business Intelligence & Reporting

Dashboards people actually check.

Business intelligence dashboards that turn scattered data into decisions your team can actually act on — not another report nobody opens.
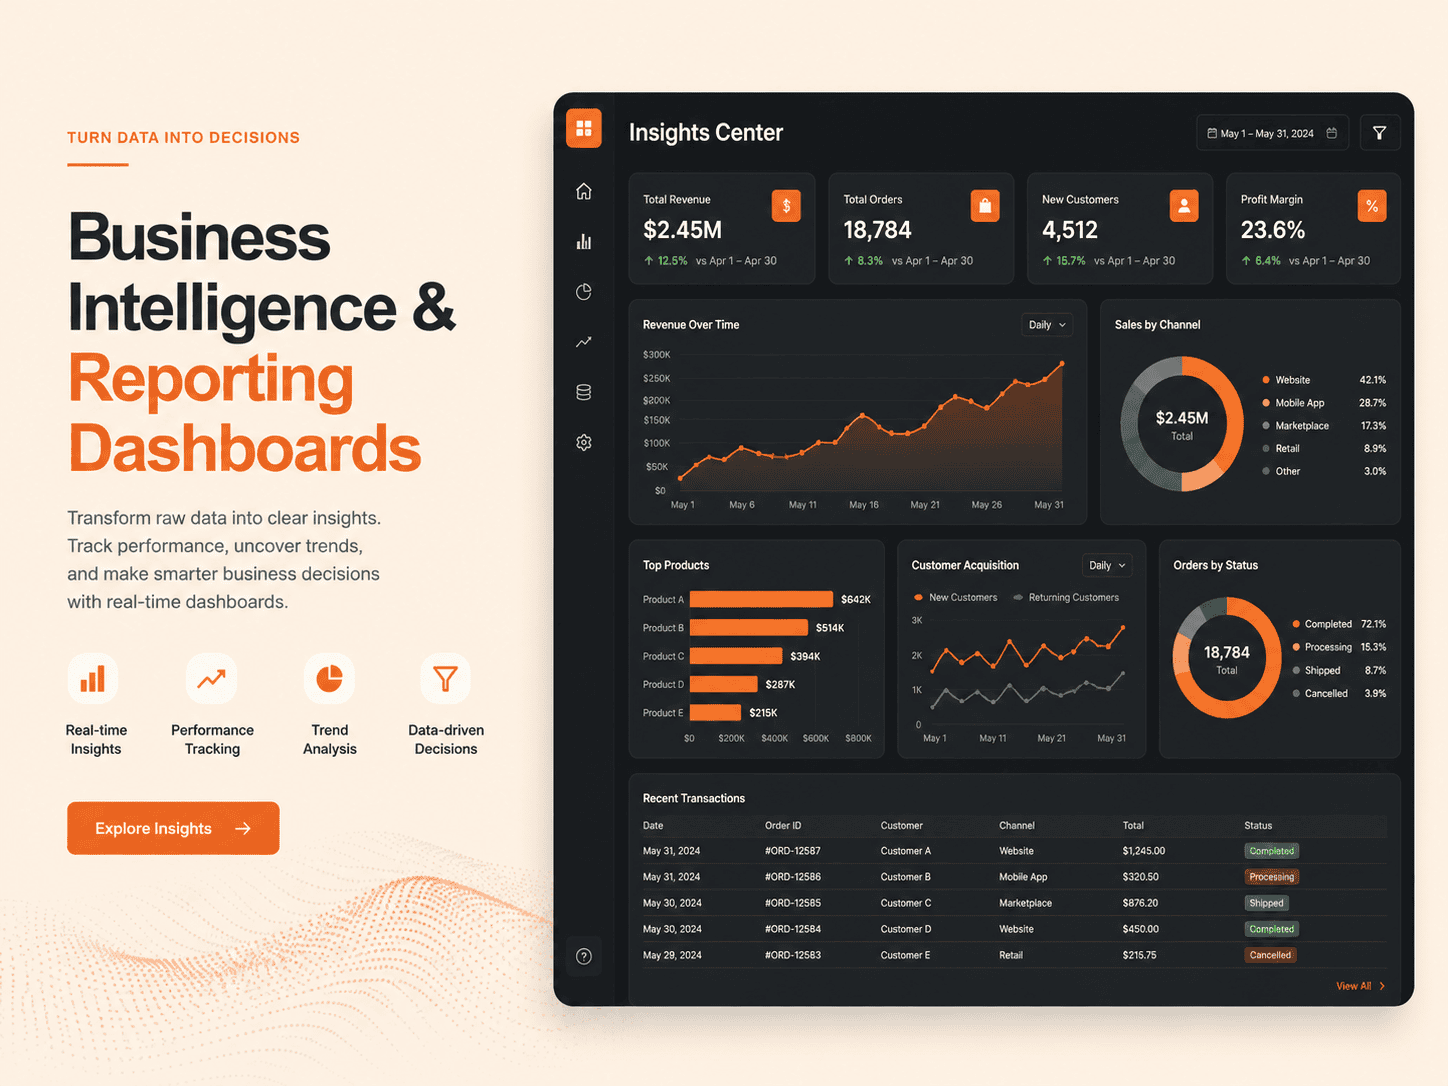
Business Intelligence & Reporting Dashboards digitallyscaled
60+
Dashboards Built
97%
Client Satisfaction
3–6 wks
Avg. Build Time
24/7
Support
Overview

Why most dashboards genuinely go unused after the initial excitement fades

Many BI projects deliver technically impressive dashboards that genuinely go unused within weeks of launch, since the initial excitement of a new tool fades quickly if the dashboard doesn't answer questions people actually need answered on a recurring basis. Dashboards people genuinely keep checking are built around real decision-making needs, not comprehensive metric coverage for its own sake — showing exactly what matters for the specific decisions your team makes regularly, rather than everything that could theoretically be measured.

We build dashboards pulling from whatever data sources genuinely matter to your business, connecting disparate systems into unified, reliable views rather than requiring manual data compilation. Automatic updates keep dashboards genuinely current, since stale data that requires manual refresh quickly gets abandoned in favor of whatever spreadsheet people trust more. Different teams get different views tailored to their actual responsibilities, since a dashboard trying to serve everyone equally often serves no one particularly well. Where you don't already have solid underlying data infrastructure, we build the pipeline too, since a polished dashboard sitting on top of unreliable data ultimately produces the exact mistrust it was meant to prevent.

What's Included

Everything this solution actually covers

Custom Dashboards

Dashboards built around the specific decisions your team actually needs to make.

Data Pipeline Setup

Reliable pipelines that keep dashboards current without manual updates.

Multi-Source Integration

Data pulled together from separate systems into one clear view.

Role-Based Views

Different dashboards for different teams, showing what's relevant to each.

Automated Reporting

Scheduled reports delivered automatically instead of built by hand each month.

Ongoing Refinement

We refine dashboards as your metrics and priorities evolve.

Our Process

How we get there

01

Discover

We identify the specific decisions each dashboard needs to support.

02

Design

We design dashboard layouts around clarity, not just showing everything available.

03

Build

We build data pipelines and dashboards with proper validation.

04

Launch & Refine

We launch and refine based on how teams actually use the dashboards.

Tech We Use

Built on tools that scale with you

Looker StudioPower BIdbtSQL
Recent Work

A few projects we’ve shipped recently

Fallowmere Group
Finance

Fallowmere Group

A unified financial dashboard replacing three separate manually-built reports.

View Case Study
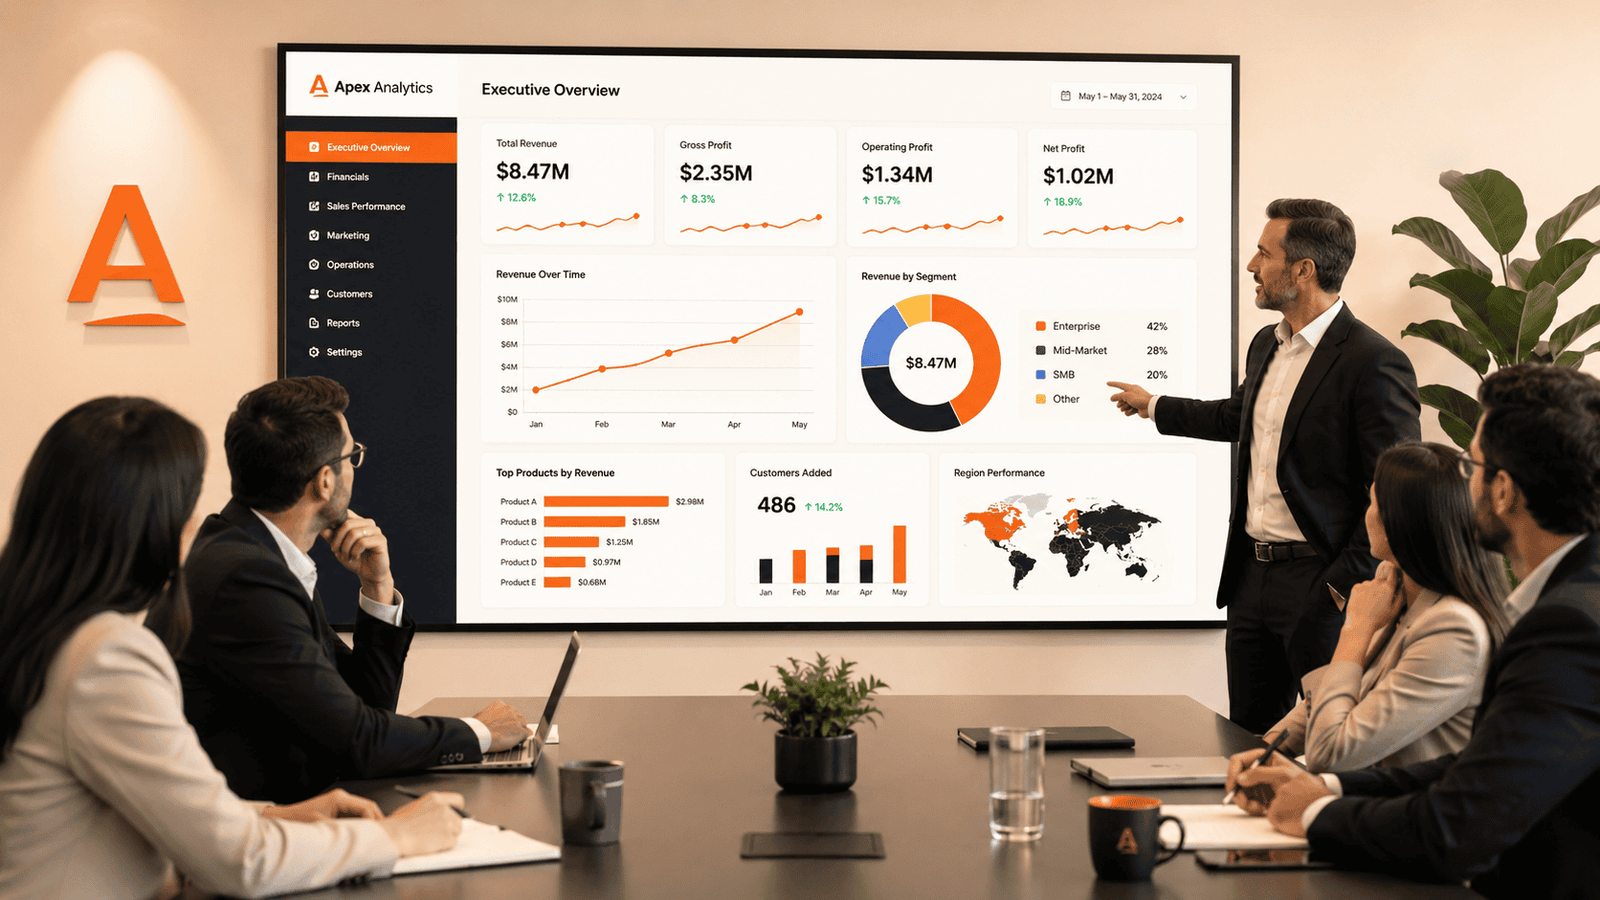
Granger Retail Group
Retail

Granger Retail Group

A sales performance dashboard used daily by store and regional managers.

View Case Study
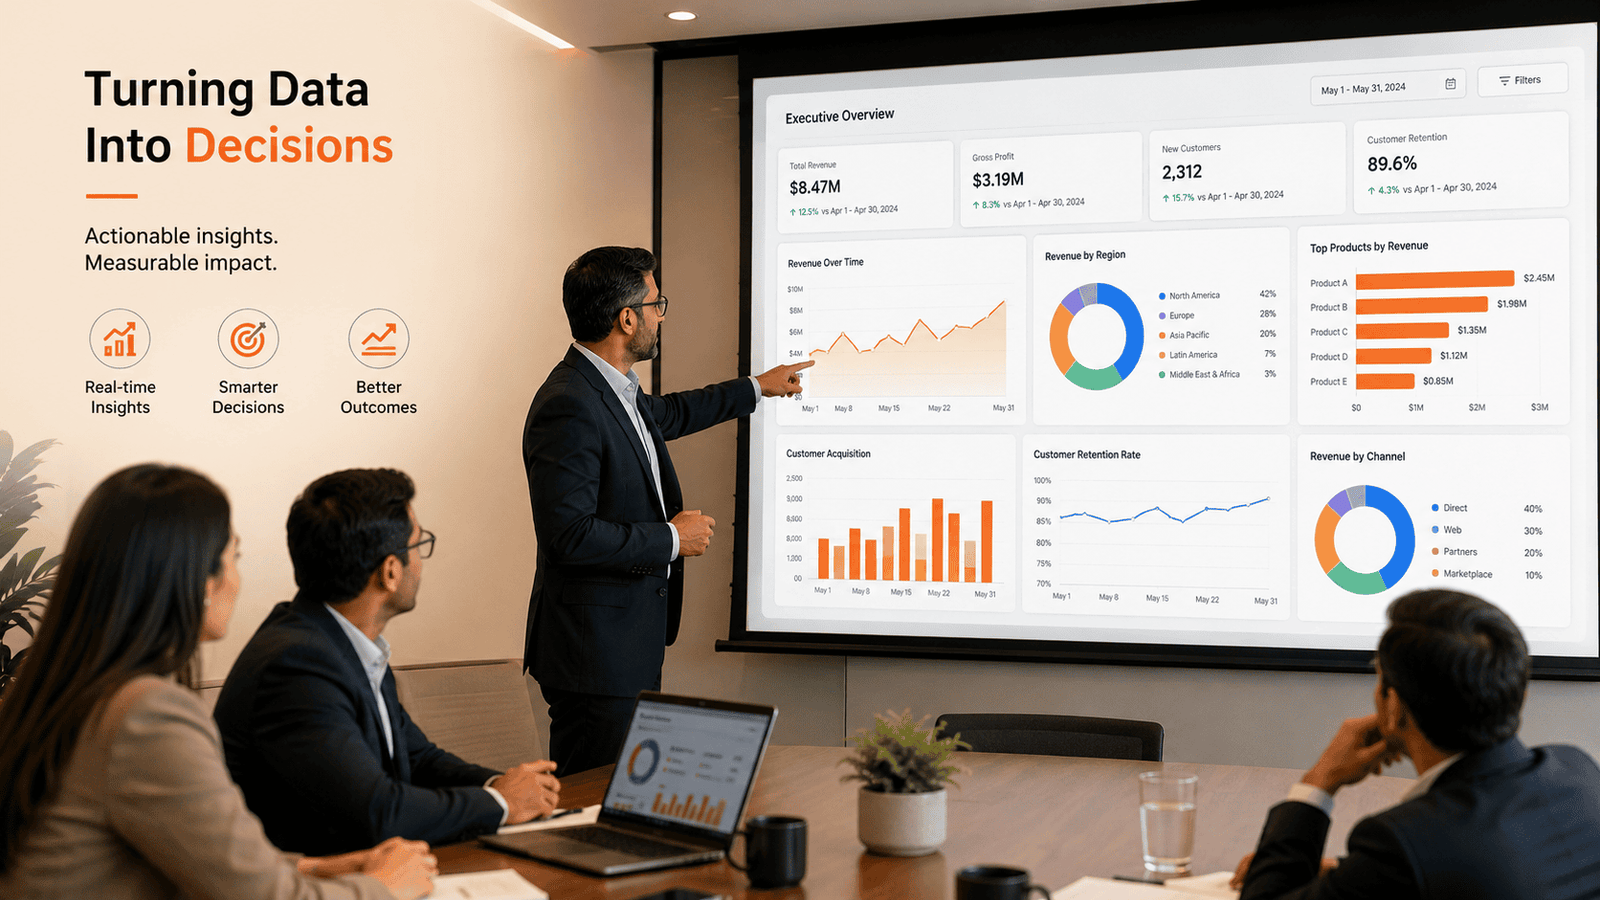
Hawksmoor Software
SaaS

Hawksmoor Software

A product usage dashboard that clarified which features actually drove retention.

View Case Study
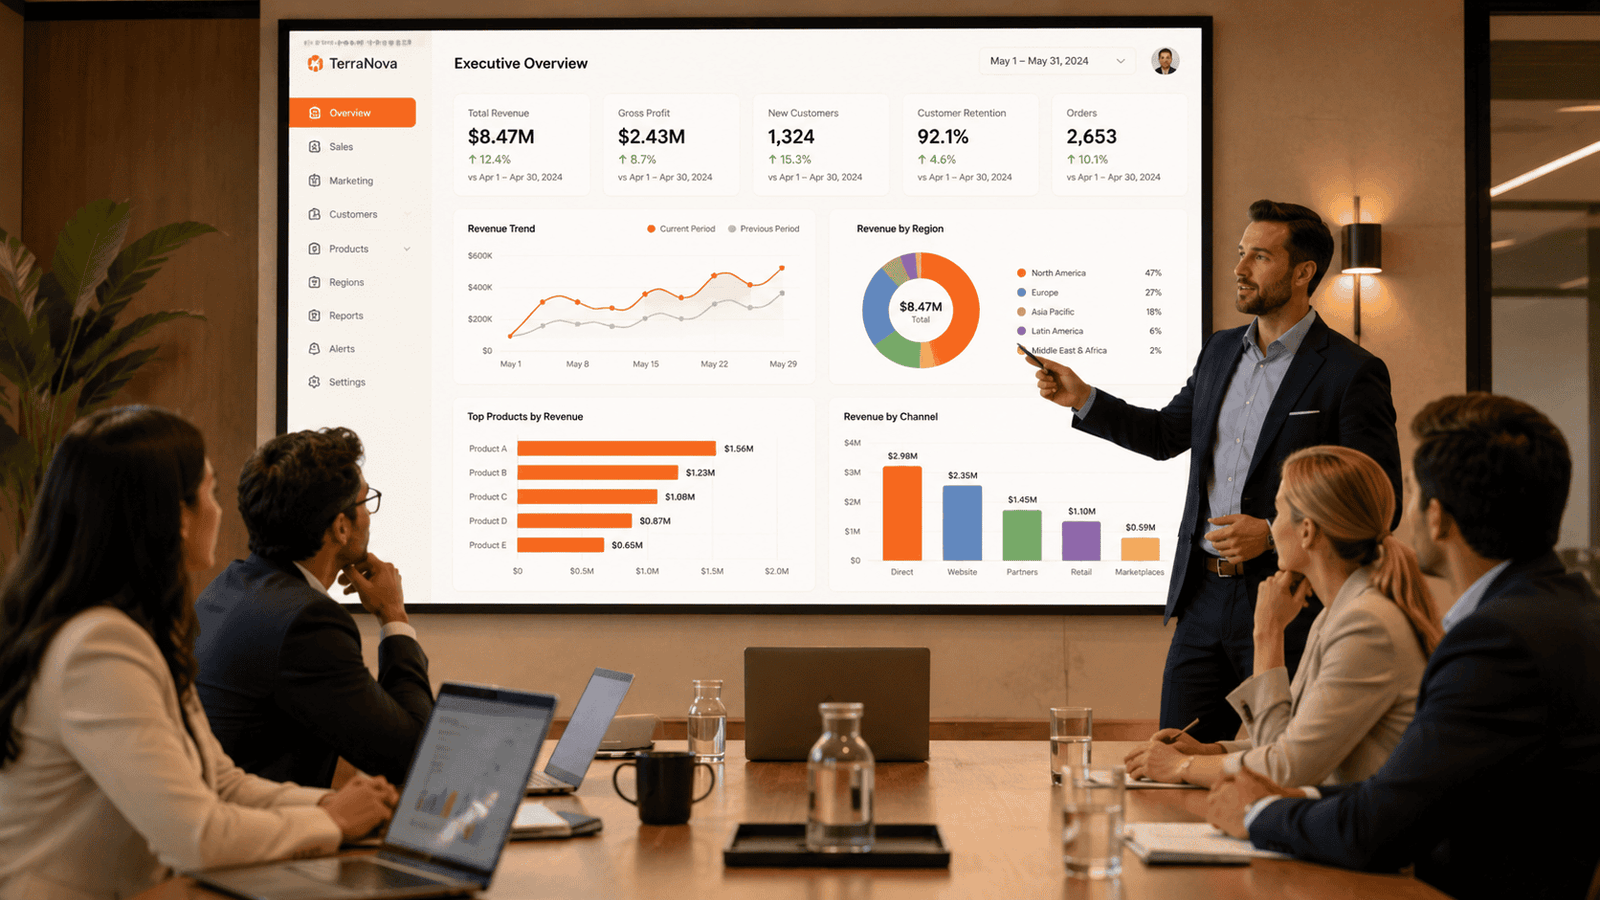
Islington Industries
Manufacturing

Islington Industries

An operations dashboard giving plant managers real-time production visibility.

View Case Study
Testimonial

What clients say

“What stood out was how specific the work was to our actual situation, not a generic playbook. +45% key metric lift within a few months, and that's held up months later.”

LK
Liora Kestrel

Owner, Fallowmere Group

FAQ

Common questions

What data sources can dashboards pull from?

Most common business tools and databases — we assess your specific stack and build the right connections.

Do dashboards update automatically?

Yes, we build reliable pipelines so dashboards stay current without manual data entry.

Can different teams see different dashboards?

Yes, role-based views are standard so each team sees what's relevant to them.

Do you build the underlying data pipeline too?

Yes, pipeline development is often part of the project, not just the dashboard on top.

How long does a typical dashboard project take?

Most projects take 3–6 weeks depending on the number of data sources and dashboards needed.

Can dashboards be accessed on mobile devices, not just desktop?

Yes, mobile-accessible dashboards let team members check key metrics away from their desk, which matters genuinely for many roles.

Do you provide training so our team understands how to interpret the dashboards?

Yes, we provide training ensuring your team genuinely understands what the metrics mean and how to act on what they're seeing.

Can we request new metrics or views after the initial dashboards are built?

Yes, ongoing refinement as your needs evolve is common, and we can structure this as part of an ongoing support arrangement.

Do dashboards include historical trend data, not just current snapshots?

Yes, historical trends alongside current status give genuine context for whether numbers represent improvement or decline over time.

Can external stakeholders like board members get limited dashboard access?

Yes, we can configure limited external access for stakeholders like board members, showing exactly the summary view they genuinely need.

How do you decide which metrics genuinely matter for our dashboards?

We start by understanding your actual decision-making processes, identifying metrics that genuinely inform decisions rather than metrics that are simply available.

Can we set up automated alerts when metrics cross certain thresholds?

Yes, threshold-based alerts help your team respond quickly to meaningful changes without needing to check dashboards constantly.

Do you support drill-down capability from summary to detailed data?

Yes, drill-down navigation from summary views into underlying detail supports genuine investigation when numbers raise questions.

Can dashboards be embedded into other tools we already use?

Yes, embedding dashboards into other tools your team already uses reduces the friction of switching between separate applications.

Do you help identify which data sources are actually worth connecting?

Yes, we help prioritize which data sources genuinely add value to your reporting, avoiding unnecessary complexity from connecting everything indiscriminately.

Can dashboards support what-if scenario modeling, not just historical data?

Yes, scenario modeling capability can be integrated for teams wanting to explore hypothetical outcomes alongside historical reporting.

Do you offer ongoing support after dashboards are built?

Yes, ongoing support helps refine dashboards as your business questions and data sources continue evolving after launch.

Ready to get started with Business Intelligence & Reporting Dashboards?

Let's talk about your project — no pressure, just a straightforward conversation about what you need.

Book an Appointment

This website stores cookies on your computer. Cookie Policy